From March 15 – 17, 2022, Kiva with support from USAID hosted a virtual Gender Equity + Financial Inclusion Forum (GEFI Forum), featuring discussions dedicated to advancing women’s economic empowerment and financial resilience. The third and final day of the GEFI Forum featured a “Data & Decision Making” session, which focused on how investors can leverage data within their investment processes in order to drive both financial and impact performance. A link to view “Data & Decision Making: Using better data to improve investment processes” in its entirety can be found below.
Understanding the gaps
Although microfinance institutions (MFIs), social service providers, and nonprofit organizations gather client data through their operational processes, oftentimes, the data remains a static collection of information. What’s more, when data is collected, it is often not disaggregated by sex, preventing organizations from understanding differences in experiences among male and female clients.
Data & decision making panelists
Building on prior sessions, panelists Mayra Buvinic (Data2X and the Center for Global Development), Ashley Monson (Tableau Foundation), Ana Barrera (Aflore), and Spencer MacColl (Kiva) discussed the importance of not only collecting sex-disaggregated data, but also using, analyzing, and leveraging sex-disaggregated data to advance gender equity. As panel moderator Wade Channell (independent consultant) noted, improving investor decision-making to drive gender equity is not just about “using better data, but using data better.”
Proposed solutions
Sex-disaggreagred data collection
Sex-disaggregated data provides a more nuanced understanding of women and men’s experiences, while also revealing both where and to what extent gender gaps remain. In order to understand, evaluate, and serve women “we need to be able to see them in the data,” said Monson. “Who are they? Where do they live, what are the income levels? What are their race and ethnicity?” asked Monson. Disaggregating data by sex, particularly data collected by the financial sector, allows the unique, gendered experience of women to show up in the data beyond output numbers. For example, Buvinic mentioned how sex-disaggregated data collected by financial institutions in Mexico revealed disparities in where women bank; public sector development banks in Mexico had a much higher proportion of women clients than Mexican private commercial banks, exposing a blatant gender gap among formal financial institutions’ clients. The more investors and organizations understand the detailed realities of potential clients, the more effectively they are able to track actual impact, such as women’s empowerment and agency, rather than merely reporting on output metrics, like the number of clients receiving loans.
Multiple sources
In addition to sex-disaggregated data, panelists also discussed the importance of having multiple types of data to advance both financial and gender impact.

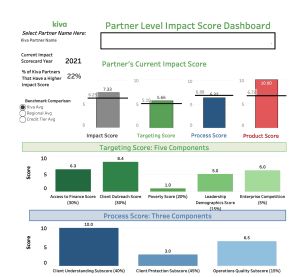
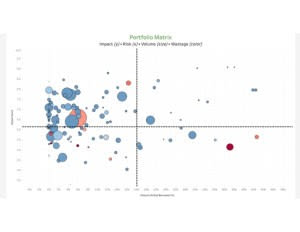
At Kiva, MacColl shared that investment decisions are informed by the aggregation of three core data sources: data collected directly from potential investees, public financial data sets using World Bank indicators, and rigorous, academic data from research institutions around the world. Triangulating these three data sources, MacColl demonstrated how data visualization tools, such as Tableau, can help investors plot a potential portfolio across both financial risk and impact. Monson, Social Impact Manager at Tableau, echoed the importance of bringing multiple data sources together. “One data point looks different depending on the context you’re viewing it from,” said Monson, so analyzing multiple data sources on top of one other provides additional nuance and depth.

Benefits & limitations of digital data
Data visualization has become a crucial tool- one that not only facilitates investor decision-making processes, but also drives the conversation around gender equity in a meaningful way. The use of data has generated evidence-based excitement and positive momentum over the past five to ten years of gender-related investments “Data has helped generate a ton of buy-in [for gender lens investing],” said Monson, “and I think that that’s an excellent use case and an excellent success for the use of data and the sector.”
However, despite the increasingly visible role data analytics has played within the GLI sector, MacColl noted that 75% of companies who apply to Kiva for financing still report that they collect data on paper. Although data visualization has proven to be an effective tool, Buvinic pointed out that “there’s simply a logistical issue” given that digital technologies require data to be machine-readable. Although free, offline data collection tools are becoming increasingly available, bringing data collection processes from analog to digital remains both a logistical and financial challenge for financial institutions. “Every bit of data collected has a cost,” noted Channell, “and sometimes, that cost can be overwhelming for small investees.”
The role of the investor
To address the logistical and financial challenges associated with the transition away from analog data, MacColl pointed to the supportive role investors can play in facilitating the shift towards digital collection processes. “Investors want to feel confident that they’re having a social impact,” said MacColl, “and a lot of investees don’t have the resources, training or prioritization to collect this data.” However, given that all parties- investors, investees, and end clients- benefit from more information, “it’s important that investors support the collection of demand-side data from their end clients,” said MacColl, either through financing or technical assistance to help build out integration.
Speaking from her experience with Aflore, a Colombian financial service provider, Barrera added that not only investors, but also board members, can champion the collection and usage of digital, sex-disaggregated data. Barrera shared how Women’s World Banking, a board member of Aflore, assisted in the creation of a Gender Action Plan that not only established a baseline for Aflore, but also benchmarked Aflore’s progress and goals. Barrera explained that the insights generated from the Gender Action Plan created a communication “feedback loop” with the board that continues to align progress, data collection, and “really helps build the case for getting better.”
Feedback loops
Feedback loops such as Aflore’s are critical not just across investors, board members, and other stakeholders, but within the data itself. Although “there will always be work to be done to close the gender data gap,” acknowledged Monson, the constant need to gather more, high-quality data should not prevent organizations from leveraging data today to deliver meaningful services. Instead, starting to use the data available to drive decision-making will subsequently guide the type of data that an organization should collect going forward. “Data is not just this static thing that you look at,” stated Monson, but something to be utilized, leveraged, and explored. Creating a feedback loop of data in this way should ultimately bring about more questions that inform meaningful change for all stakeholders involved.
Maintaining humanity within data
Emphasizing the need for data to drive decision-making and advance gender equity, the panel concluded by grounding data within the human experience that it ultimately represents. Though statistics, percentages, and rounding errors can often obscure the humanity within the numbers, “when I see data, I see faces,” said Channell, because ultimately, “data is human.” And when used meaningfully, data becomes a powerful tool to improve the human experience.
Missed the live GEFI Forum session? Watch a recording of the virtual Data & Decision Making session to learn more.


